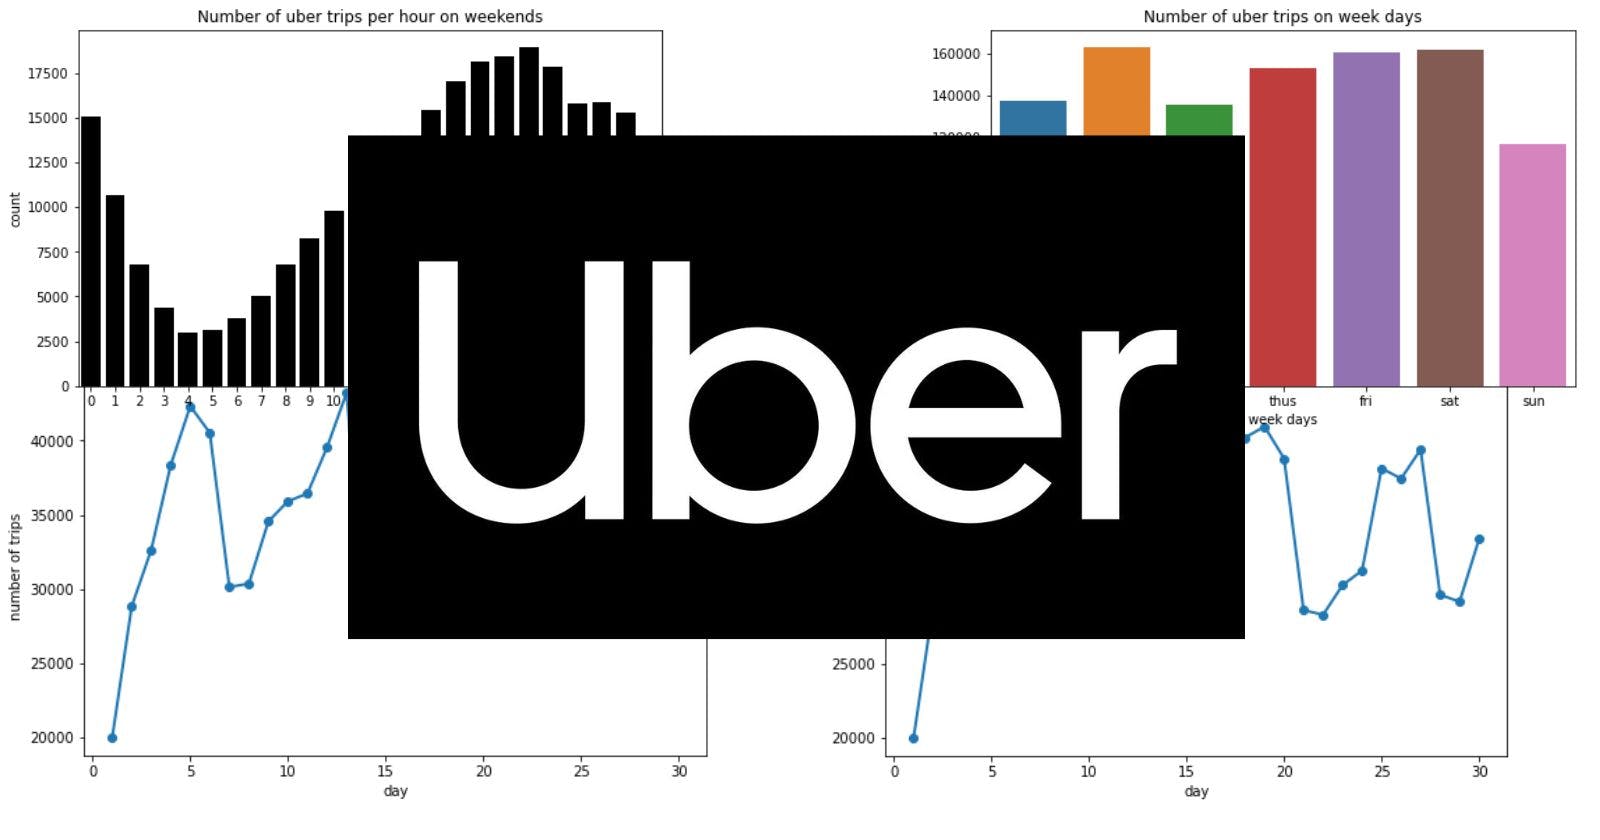


What is uber?
Uber is an independent taxicab company that hires drivers who use their personal vehicles while logged into the Uber app on a mobile device. Passengers request rides using the app, inputting pick-up and drop-off locations, and all payment is done through a pre-authorized credit card right through the app.
About this project
This dataset has 1 million rows and four columns. I personally have the interest to know more about uber and its data. And this dataset grabbed my attention to analyze this data.
This dataset contains the uber rides pickups in New York City. All data points lie in September month of 2014.
Features: dateAndTime, Lat, Lon, Base
My Findings
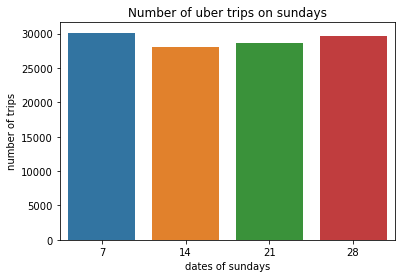
1. Sunday has the least number of trips in a week
And Tuesday has the highest trips in a week
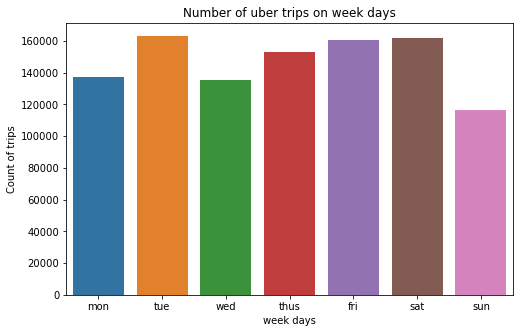
- Tue: 163230
- Sat: 162057
- Fri: 160380
- Thus: 153276
- Mon: 137288
- Wed: 135373
- Sun: 116532
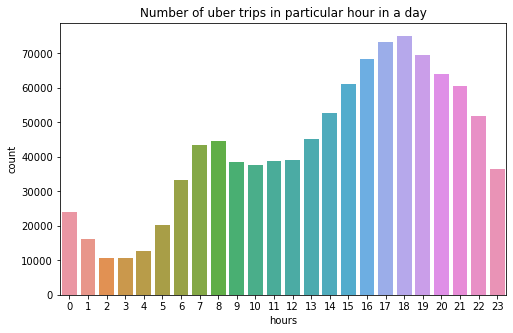
2.Hourly analysis - 4 PM to 8 PM has more rides in a day
Uber rides get a noticeable hike From 7 AM and again drop in the lunchtime.
At 6 PM uber has the highest number of bookings.
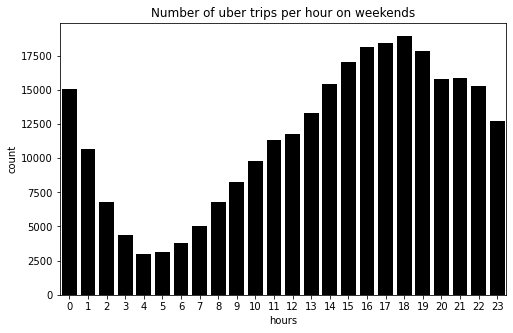
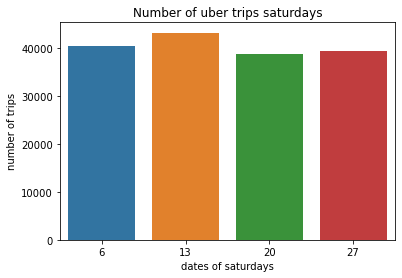
3.There are significant drops in bookings on weekends
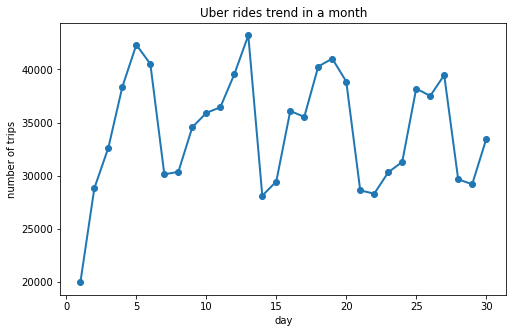
day 13th has the highest bookings in September month (43205 bookings)
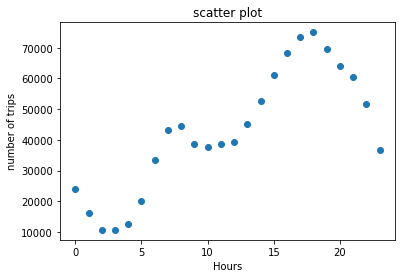
4. Hours and Trips have a strong correlation
correlation between Hours and Trips: 0.81205
5. Weekends have more percentage of midnight bookings compared to normal days
6. Saturdays and Sundays have a similar amount of bookings
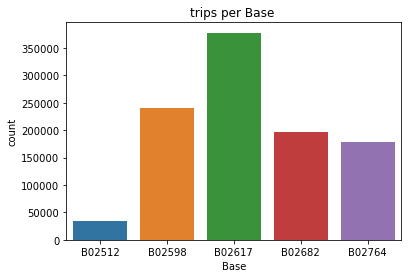
7. The B02617 Base(Weiter) has the highest bookings
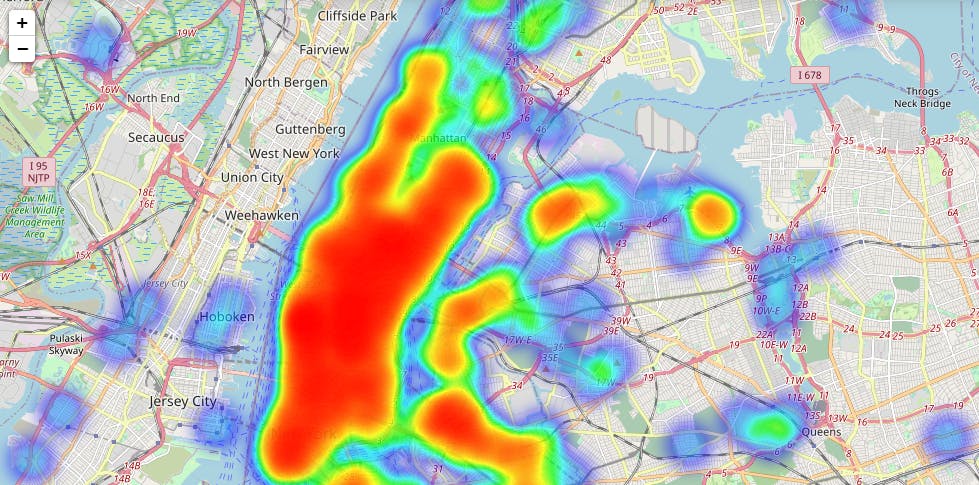
8. Manhattan has the highest bookings in NewYork City