
Goal
This analysis aims to perform EDA and answer the following questions.
- Which are the Top 10 Countries that won medals?
- What is the trend between men and women over time?
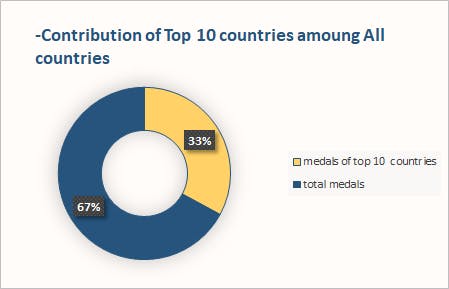
- What is the contribution of the top ten countries over all other countries?
Note: The dataset used in this project is from an external resource (kaggle). Tools Used: MS Excel
Features/columns of the data set
- Name - Athlete's name
- ID - Unique number for each athlete
- Sex - M or F
- Age - Integer
- Height - In centimeters
- Weight - In kilograms
- Team - Team name
- NOC - National Olympic Committee 3-letter code
- Games - Year and season
- Year - Integer
- Season - Summer or Winter
- City - Host city
- Sport - Sport
- Event - Event
- Medal - Gold, Silver, Bronze, or NA
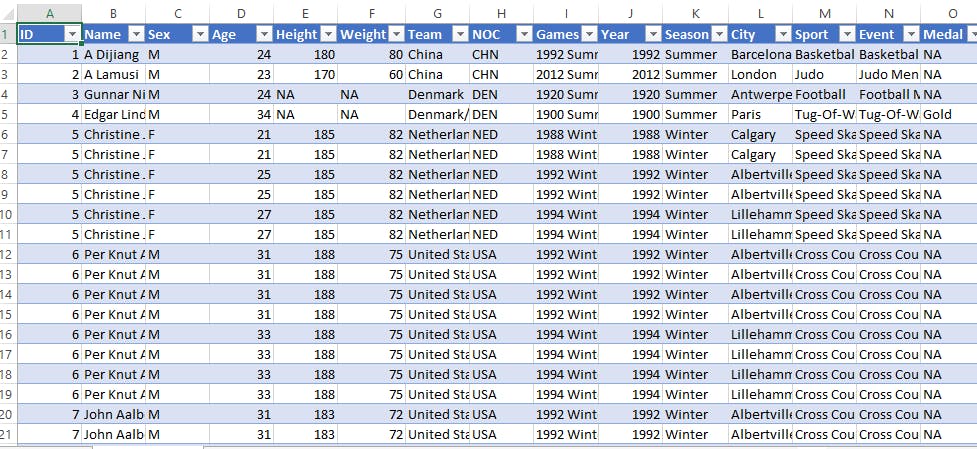
Sneak peek of the dataset
Women's performance was diminutive initially
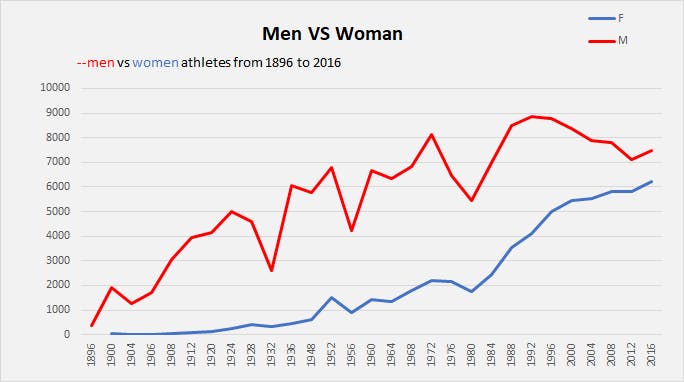
This line plot is the trend of the summer Olympics from 1896 to 2016.
but over time it increased and trying align with men trend
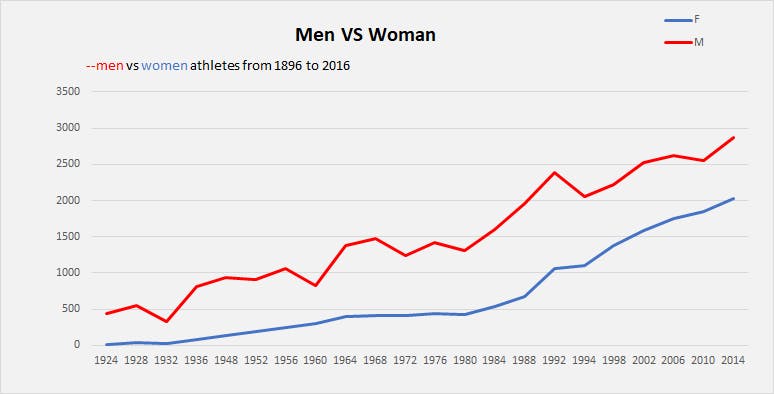
This line plot is the trend of the winter Olympics from 1896 to 2016
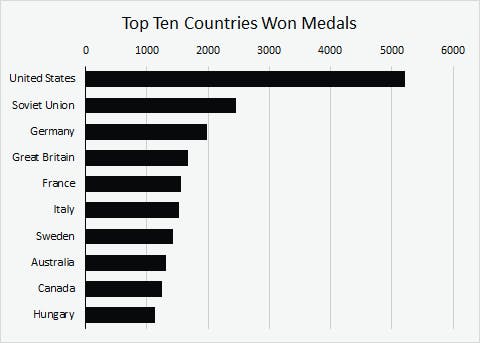
Which are the Top 10 Countries that won medals?
USA is the leading team till 2016
Contribution of top ten countries’ medals among all other countries?